Line/Plot Examples.
set_line_style(width = 1, dot_size = 0)
This function allow you to customise the way lines are drawn in charts.
This function only applies during chart drawing calls ( line charts,.. ).
You can specify the width of the lines & if they are dotted.
draw_from_png(file_name, x, y, alpha = 100)
draw_from_jpg(file_name, x, y, alpha = 100)
This function allows you to merge an external PNG/JPG picture with your graph specifying the position and the transparency

Show / Hide Source Code
        # Playing with line style & pictures inclusion
        require 'rubygems'
        require 'rchart'

        p = Rdata.new
        p.add_point([10,9.4,7.7,5,1.7,-1.7,-5,-7.7,-9.4,-10,-9.4,-7.7,-5,-1.8,1.7],"Serie1")
        p.add_point([0,3.4,6.4,8.7,9.8,9.8,8.7,6.4,3.4,0,-3.4,-6.4,-8.6,-9.8,-9.9],"Serie2")
        p.add_point([7.1,9.1,10,9.7,8.2,5.7,2.6,-0.9,-4.2,-7.1,-9.1,-10,-9.7,-8.2,-5.8],"Serie3")
        p.add_point(["Jan","Jan","Jan","Feb","Feb","Feb","Mar","Mar","Mar","Apr","Apr","Apr","May","May","May"],"Serie4")
        p.add_all_series()
        p.set_abscise_label_serie("Serie4")
        p.set_serie_name("Max Average","Serie1")
        p.set_serie_name("Min Average","Serie2")
        p.set_serie_name("Temperature","Serie3")
        p.set_serie_name("Temperature")
        p.set_y_axis_name("Temperature")
        p.set_x_axis_name("Month of the year")

        ch = Rchart.new(700,230)
        ch.set_fixed_scale(-12,12,5)
        ch.set_font_properties("../fonts/tahoma.ttf",8)
        ch.set_graph_area(65,30,570,185)
        ch.draw_filled_rounded_rectangle(7,7,693,223,5,240,240,240)
        ch.draw_rounded_rectangle(5,5,695,225,5,230,230,230)
        ch.draw_graph_area(255,255,255,true)
        ch.draw_scale(p.get_data,p.get_data_description,Rchart::SCALE_NORMAL,150,150,150,true,0,2,true,3)
        ch.draw_grid(4,true,230,230,230,50)

        #draw 0 line
        ch.set_font_properties("tahoma.ttf",6)
        ch.draw_treshold(0,143,55,72,true,true)

        #draw area
        p.remove_serie("Serie4")
        ch.draw_area(p.get_data, "Serie1", "Serie2", 239,238,227,50)
        p.remove_serie("Serie3")
        ch.draw_line_graph(p.get_data,p.get_data_description)

        #draw line graph
        ch.set_line_style(1,6)
        p.remove_all_series
        p.add_serie("Serie3")
        ch.draw_line_graph(p.get_data,p.get_data_description)
        ch.draw_plot_graph(p.get_data,p.get_data_description,3,2,255,255,255)

        #write values on serie3
        ch.set_font_properties("tahoma.ttf",8)
        ch.write_values(p.get_data,p.get_data_description, "Serie3")

        #Finish the graph
        ch.set_font_properties("tahoma.ttf",8)
        ch.draw_legend(590,90,p.get_data_description,255,255,255)
        ch.set_font_properties("tahoma.ttf",10)
        ch.draw_title(60,22,"Example 15",50,50,50,585)
        ch.draw_from_png("logo.png",584,35)
        ch.render_png("logo-style")
Line Examples With Shadow.
set_shadow_properties(x_distance = 1, y_distance = 1, r = 60, g = 60, b = 60, alpha = 50, blur = 0)
Use this function to set shadow properties

Show / Hide Source Code
        # Playing with background

        require 'rubygems'
        require 'rchart'

        p = Rdata.new
        p.add_point([9,9,9,10,10,11,12,14,16,17,18,18,19,19,18,15,12,10,9],"Serie1")
        p.add_point([10,11,11,12,12,13,14,15,17,19,22,24,23,23,22,20,18,16,14],"Serie2")
        p.add_point([4,5,6,7,8,9,10,11,12,13,14,15,16,17,18,19,20,21,22],"Serie3")
        p.add_all_series
        p.remove_serie("Serie3")
        p.set_abscise_label_serie("Serie3")
        p.set_serie_name("January","Serie1")
        p.set_serie_name("February","Serie2")
        p.set_y_axis_name("Temperature")
        p.set_y_axis_unit("°C")
        p.set_x_axis_unit("h")

        ch = Rchart.new(700,230)
        ch.draw_graph_area_gradient(132,153,172,50,Rchart::TARGET_BACKGROUND)
        ch.set_font_properties("tahoma.ttf",8)
        ch.set_graph_area(60,20,585,180)
        ch.draw_graph_area(213,217,221,false)
        ch.draw_scale(p.get_data,p.get_data_description,Rchart::SCALE_NORMAL,213,217,221,true,0,2)
        ch.draw_graph_area_gradient(162,183,202,50)
        ch.draw_grid(4,true,230,230,230,20)

        # Draw the line chart
        ch.set_shadow_properties(3,3,0,0,0,30,4)
        ch.draw_line_graph(p.get_data,p.get_data_description)
        ch.clear_shadow
        ch.draw_plot_graph(p.get_data,p.get_data_description,4,2,-1,-1,-1,true)

        ch.set_font_properties("tahoma.ttf",8)
        ch.draw_legend(605,142,p.get_data_description,236,238,240,52,58,82)
        title= "Average Temperatures during the first months of 2008  "
        ch.draw_text_box(0,210,700,230,title,0,255,255,255,Rchart::ALIGN_RIGHT,true,0,0,0,30)
        ch.add_border(2)

        ch.render_png("line-shadow")
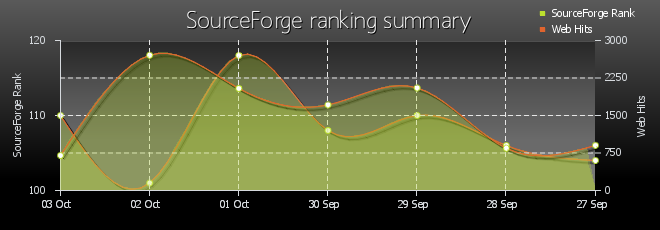
Two Y Axis Chart With Shadow.

Show / Hide Source Code
        #Two Y axis / shadow demonstration
        require 'rubygems'
        require 'rchart'

        p = Rdata.new
        p.add_point([110,101,118,108,110,106,104],"Serie1")
        p.add_point([700,2705,2041,1712,2051,846,903],"Serie2")
        p.add_point(["03 Oct","02 Oct","01 Oct","30 Sep","29 Sep","28 Sep","27 Sep"],"Serie3")
        p.add_serie("Serie1")
        p.set_abscise_label_serie("Serie3")
        p.set_serie_name("SourceForge Rank","Serie1")
        p.set_serie_name("Web Hits","Serie2")


        ch = Rchart.new(660,230)
        ch.draw_graph_area_gradient(90,90,90,90,Rchart::TARGET_BACKGROUND)
        ch.set_font_properties("tahoma.ttf",8)
        ch.set_graph_area(60,40,595,190)
        ch.set_font_properties("tahoma.ttf",8)
        # Draw the SourceForge Rank graph
        p.set_y_axis_name("SourceForge Rank")
        ch.draw_scale(p.get_data,p.get_data_description,Rchart::SCALE_NORMAL,213,217,221,true,0,0)
        ch.draw_graph_area_gradient(40,40,40,-50)
        ch.draw_grid(4,true,230,230,230,10)

        ch.set_shadow_properties(3,3,0,0,0,30,4)
        ch.draw_cubic_curve(p.get_data,p.get_data_description)
        ch.clear_shadow
        ch.draw_filled_cubic_curve(p.get_data,p.get_data_description,0.1,30)
        ch.draw_plot_graph(p.get_data,p.get_data_description,3,2,255,255,255)
        ch.clear_scale

        #draw 2nd graph
        p.remove_serie("Serie1")
        p.add_serie("Serie2")
        p.set_y_axis_name("Web Hits")

        ch.draw_right_scale(p.get_data,p.get_data_description,Rchart::SCALE_NORMAL,213,217,221,true,0,0)
        ch.draw_grid(4,true,230,230,230,10)
        ch.set_shadow_properties(3,3,0,0,0,30,4)
        ch.draw_cubic_curve(p.get_data,p.get_data_description)
        ch.clear_shadow
        ch.draw_filled_cubic_curve(p.get_data,p.get_data_description,0.1,30)
        ch.draw_plot_graph(p.get_data,p.get_data_description,3,2,255,255,255)
        ch.clear_scale


        ch.set_font_properties("tahoma.ttf",8)
        ch.draw_legend(530, 5, p.get_data_description, 0,0,0,0,0,0,255,255,255,false)

        ch.set_font_properties("MankSans.ttf",18)
        ch.set_shadow_properties(1,1,0,0,0)
        ch.draw_title(0,0,"SourceForge ranking summary",255,255,255,660,30,true)
        ch.clear_shadow

        ch.render_png("2y-axis")