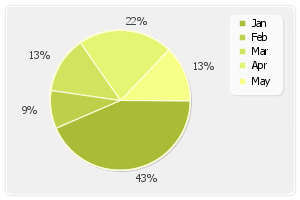
Basic Pie Chart Examples.
draw_basic_pie_graph(data, data_description, x_pos, y_pos, radius = 100,
draw_labels = PIE_NOLABEL, r = 255, g = 255, b = 255, decimals = 0)
draw_labels contain one of the following paramter
- Rchart:: PIE_NOLABEL No labels displayed
- Rchart:: PIE_PERCENTAGE Percentages are displayed
- Rchart:: PIE_LABELS Series labels displayed
- Rchart:: PIE_PERCENTAGE_LABEL Series labels & percentage displayed

Show / Hide Source Code
        # A smooth flat pie graph
        require 'rubygems'
        require 'rchart'

        p = Rdata.new
        p.add_point([10,2,3,5,3],"Serie1")
        p.add_point(["Jan","Feb","Mar","Apr","May"],"Serie2")
        p.add_all_series
        p.set_abscise_label_serie("Serie2")

        ch = Rchart.new(300,200)
        ch.draw_filled_rounded_rectangle(7,7,293,193,5,240,240,240)
        ch.draw_rounded_rectangle(5,5,295,195,5,230,230,230)

        # Load palette from array [[r,g,b],[r1,g1,b1]]
        ch.load_color_palette([[168,188,56],[188,208,76],[208,228,96],[228,245,116],[248,255,136]])
        ch.draw_filled_circle(122,102,70,200,200,200)

        ch.set_font_properties("tahoma.ttf",8)

        # Draw Basic Pie Graph
        ch.draw_basic_pie_graph(p.get_data,p.get_data_description,120,100,70,Rchart::PIE_PERCENTAGE,255,255,218)
        ch.draw_pie_legend(230,15,p.get_data,p.get_data_description,250,250,250)

        ch.render_png("basic-pie")
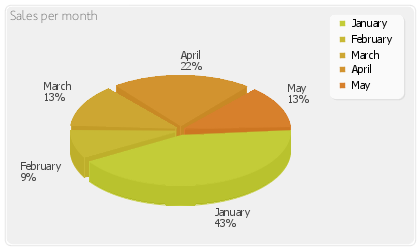
3D Pie Chart Examples.
draw_pie_graph(data, data_description, x_pos, y_pos, radius = 100, draw_labels = PIE_NOLABEL,
enhance_colors = true, skew = 60, splice_height = 20, splice_distance = 0, decimals = 0)

Show / Hide Source Code
        require 'rubygems'
        require 'rchart'

        p = Rdata.new
        p.add_point([10,2,3,5,3],"Serie1")
        p.add_point(["January","February","March","April","May"],"Serie2")
        p.add_all_series
        p.set_abscise_label_serie("Serie2")

        ch = Rchart.new(420,250)
        ch.draw_filled_rounded_rectangle(7,7,413,243,5,240,240,240)
        ch.draw_rounded_rectangle(5,5,415,245,5,230,230,230)
        ch.create_color_gradient_palette(195,204,56,223,110,41,5)
        ch.set_font_properties("tahoma.ttf",8)
        ch.antialias_quality=0

        ch.draw_pie_graph(p.get_data,p.get_data_description,180,130,110,Rchart::PIE_PERCENTAGE_LABEL,false,50,20,5)
        ch.draw_pie_legend(330,15,p.get_data,p.get_data_description,250,250,250)

        #Write the title
        ch.set_font_properties("MankSans.ttf",10)
        ch.draw_title(10,20,"Sales per month",100,100,100)
        ch.render_png("3D-pie")
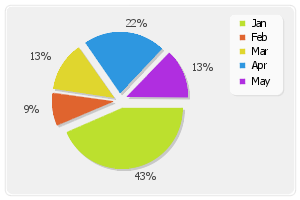
Flat Pie Chart With Shadow Examples.
draw_flat_pie_graph_with_shadow(data, data_description, x_pos, y_pos, radius = 100,
draw_labels = PIE_NOLABEL, splice_distance = 0, decimals = 0)

Show / Hide Source Code
        #A 2D exploded pie graph
        require 'rubygems'
        require 'rchart'

        p = Rdata.new
        p.add_point([10,2,3,5,3],"Serie1")
        p.add_point(["Jan","Feb","Mar","Apr","May"],"Serie2")
        p.add_all_series
        p.set_abscise_label_serie("Serie2")

        ch = Rchart.new(300,200)
        ch.set_font_properties("tahoma.ttf",8)
        ch.draw_filled_rounded_rectangle(7,7,293,193,5,240,240,240)
        ch.draw_rounded_rectangle(5,5,295,195,5,230,230,230)

        # Draw the pie chart
        ch.antialias_quality=0
        ch.set_shadow_properties(2,2,200,200,200)
        ch.draw_flat_pie_graph_with_shadow(p.get_data,p.get_data_description,120,100,60,Rchart::PIE_PERCENTAGE,8)
        ch.clear_shadow
        ch.draw_pie_legend(230,15,p.get_data,p.get_data_description,250,250,250)

        ch.render_png("flat-pie-chart")