Basic Line and Plot Chart Examples.
draw_line_graph(data, data_description, serie_name = "")
This function will draw a line graph using all the registered series.
draw_plot_graph(data, data_description, big_radius = 5, small_radius = 2, r2 = 1, g2 = 1, b2 = 1, shadow = false)
This function will draw a plot graph using all the registered series.
Giving only the data & data_description structure will draw the basic plot graph,
You can specify the radius ( external & internal ) of the plots.
You can also specify the color of the points ( will be unique in case of multiple series ).
Setting Shadow to true will draw a shadow under the plots.
draw_xy_plot_graph(data, data_description, y_serie_name, x_serie_name, palette_id = 0,
big_radius = 5, small_radius = 2, r2 = 1, g2 = 1, b2 = 1, shadow = true)
This function is very similar as the draw_plot_graph function.
You must specify the name of the two series that will be used as x and y coordinates and the color id to use.

Show / Hide Source Code
        # Showing how to use labels and Line/Plot Chart
        require 'rubygems'
        require 'rchart'

        p = Rdata.new
        p.add_point([0,70,70,0,0,70,70,0,0,70],"Serie1")
        p.add_point([0.5,2,4.5,8,12.5,18,24.5,32,40.5,50],"Serie2")
        p.add_all_series()
        p.set_abscise_label_serie
        p.set_serie_name("January","Serie1")
        p.set_serie_name("February","Serie2")

        ch = Rchart.new(700,230)
        ch.set_font_properties("../fonts/tahoma.ttf",8)
        ch.set_graph_area(50,30,585,200)
        ch.draw_filled_rounded_rectangle(7,7,693,223,5,240,240,240)
        ch.draw_rounded_rectangle(5,5,695,225,5,230,230,230)
        ch.draw_graph_area(255,255,255,true)
        ch.draw_scale(p.get_data,p.get_data_description,Rchart::SCALE_NORMAL,150,150,150,true,0,2)
        ch.draw_grid(4,true,230,230,230,50)
        ch.set_font_properties("../fonts/tahoma.ttf",6)
        ch.draw_treshold(0,143,55,72,true,true)

        #draw line graph
        ch.draw_line_graph(p.get_data,p.get_data_description)
        ch.draw_plot_graph(p.get_data, p.get_data_description,3,2,255,255,255)

        # Set labels
        ch.set_font_properties("../fonts/tahoma.ttf",8)
        ch.set_label(p.get_data, p.get_data_description, "Serie1", "2","Daily incomes",221,230,174)
        ch.set_label(p.get_data, p.get_data_description, "Serie2", "6","Production break",239,233,195)

        ch.set_font_properties("../fonts/tahoma.ttf",8)
        ch.draw_legend(600,30,p.get_data_description,255,255,255)
        ch.set_font_properties("../fonts/tahoma.ttf",10)
        ch.draw_title(50,22,"Example 5",50,50,50,585)
        ch.render_png("basic-line-plot")
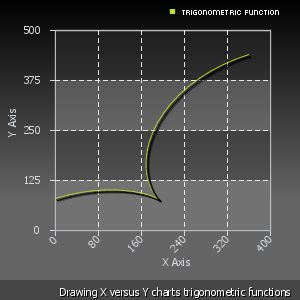
XY Chart Examples.
draw_xy_graph(data, data_description, y_serie_name, x_serie_name, palette_id = 0)
This function will draw a scatter line graph.
You must specify the x and y series that will be used.
You can optionally set the color index in the current palette.

Show / Hide Source Code
        #X versus Y char
        require 'rubygems'
        require 'rchart'
        #Compute the points
        p = Rdata.new
        i=0
        while(i<=360)
        p.add_point(Math.cos(i*Math::PI/180)*80+i,"Serie1")
        p.add_point(Math.sin(i*Math::PI/180)*80+i,"Serie2")
        i+=10

        end
        p.set_serie_name("Trigonometric function","Serie1")
        p.add_serie("Serie1")
        p.add_serie("Serie2")
        p.set_x_axis_name("X Axis")
        p.set_y_axis_name("Y Axis")
        ch = Rchart.new(300,300)
        ch.draw_graph_area_gradient(0,0,0,-100,Rchart::TARGET_BACKGROUND);
        ch.set_font_properties("tahoma.ttf",8)
        ch.set_graph_area(55,30,270,230)
        ch.draw_xy_scale(p.get_data,p.get_data_description,"Serie1","Serie2",213,217,221,true,45)
        ch.draw_graph_area(213,217,221,false)
        ch.draw_graph_area_gradient(30,30,30,-50);
        ch.draw_grid(4,true,230,230,230,20)
        ch.set_shadow_properties(2,2,0,0,0,60,4)

        # Draw XY Chart
        ch.draw_xy_graph(p.get_data,p.get_data_description,"Serie1","Serie2",0)
        ch.clear_shadow

        title= "Drawing X versus Y charts trigonometric functions  ";
        ch.draw_text_box(0,280,300,300,"#{title}",0,255,255,255,Rchart::ALIGN_RIGHT,true,0,0,0,30)
        ch.set_font_properties("pf_arma_five.ttf",6)
        p.remove_serie("Serie2")
        ch.draw_legend(160,5,p.get_data_description,0,0,0,0,0,0,255,255,255,false)
        ch.render_png("xy-chart")